In the spirit of Women's Day and with the theme 'Inspire Inclusion' at heart, we reflected on the significant journey toward gender equality in the workforce from 2016 to 2024. We think a strong indicator for this is Female Labor Force Participation Ratio (FLPR).
So we analysed over 5.8 million anonymised greytHR user records, collectively for all industries across India. And tried to understand the variance in FLPRs across the eight year period. 5.8 million is a sizeable cohort that projects workforce diversity patterns in businesses.
Through the comprehensive data from greytHR, we gain a layered understanding of female participation across industries. This reflection isn't just about looking at the numbers; it's about inspiring a movement towards a more inclusive working world.
Table of Contents
- 1. Background: What is FLPR and Why Does it Matter
- 2. Methodology of Analysis
- 3. Analysis: The State of Female Participation: Mixed Landscape of Progress and Decline
- 4. Sectors Leading and Lagging Behind
- 5. Industries Leading the Diversity Movement
- 6. TL;DR | Key Insights
- 7. Charting the Path Forward: Recommendations for Bridging the Gap
- 8. Conclusion
Background: What is FLPR and Why Does it Matter
The Female Labor Force Participation Rate (FLPR) measures the percentage of women who are actively engaged in the labor market, either by working or actively seeking employment, relative to the total female population within a working age range, typically 15 years and older. It is a crucial indicator of gender equality and economic empowerment in a country. High FLPR is significant because it contributes to economic growth, reduces poverty, promotes gender equality, and ensures a more equitable distribution of income.
The significance of the Female Labor Force Participation Rate (FLPR) extends beyond economic indicators, reflecting social and cultural transformations throughout history. Historically, women's participation in the workforce has been shaped by societal norms, educational opportunities, and legal rights. Recognizing the importance of FLPR, international organizations and governments have implemented policies aimed at increasing female employment, recognizing its role in achieving sustainable economic growth, reducing poverty, and promoting gender equality. High FLPR is a testament to progress in dismantling barriers to women's full economic participation, showcasing the ongoing journey towards more inclusive and equitable societies.
Methodology of Analysis
We collected 5.8 million records across our customers over a 9 year timeline - 2016 to 2024. This data was anonymised, and viewed in aggregates, to maintain sanctity.
We looked at the gender ratio across industries and locations and see if some patterns emerge. We put further cuts on industry, locations, company sizes to see if the trends varied accordingly.
During the analysis, we used the Covid timeline as a marker to check any correlations in gender-wise employment ratios.
Analysis: The State of Female Participation: Mixed Landscape of Progress and Decline

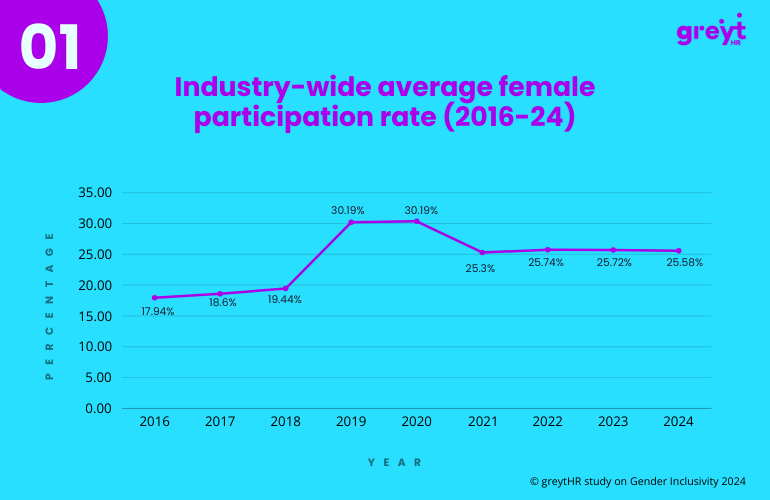
This chart illustrates the overall trend of female participation across all industries from 2016 to 2024, highlighting a concerning decline in recent years.
From 2016 and 2020, a significant uptick in female participation driven by certain sectors, notably Internet Publishing, Private Equity, and the Textiles Industry, was observed. This surge can be attributed to progressive workplace policies, increased technological accessibility, and a broader societal push towards gender equality, fostering environments where women could thrive professionally.
Conversely, sectors such as Advertising and PR, Agriculture, and Automobile Dealership witnessed declines due to economic challenges, technological disruptions, and inadequate alignment of educational opportunities with industry needs. These patterns underscore the complex interplay of economic, technological, and social dynamics influencing female workforce participation, highlighting the critical need for inclusive policies and equitable growth opportunities to sustain and enhance gender diversity across all industries.
Effect of Covid’19 on FLPR
The gains achieved in 2019 and 2020 were lost due to COVID-19 pandemic. A report by the Center for Sustainable Employment at Azim Premji University in India showed that during the first lockdown in 2020, only 7 percent of men lost their jobs, compared to 47 per cent of women who lost their jobs and did not return to work by the end of the year (2)
The trend of female participation from 2022 to 2024 reveals a flat trend of participation hovering around 25.58% by 2024. This pattern indicates female workforce hiring has not revived from the impact of global pandemic. Trend above is also validated by the ADBI's report which indicates that in India, female labor force participation is around 23% in 2021-2022 (1). This context underscores the need for initiatives that enhance formal skill training and social security benefits, which are particularly scarce for women in India.
Sectors Leading and Lagging Behind
The landscape of female participation is varied, with certain industries showcasing more inclusive environments than others.
Top Performing Industries

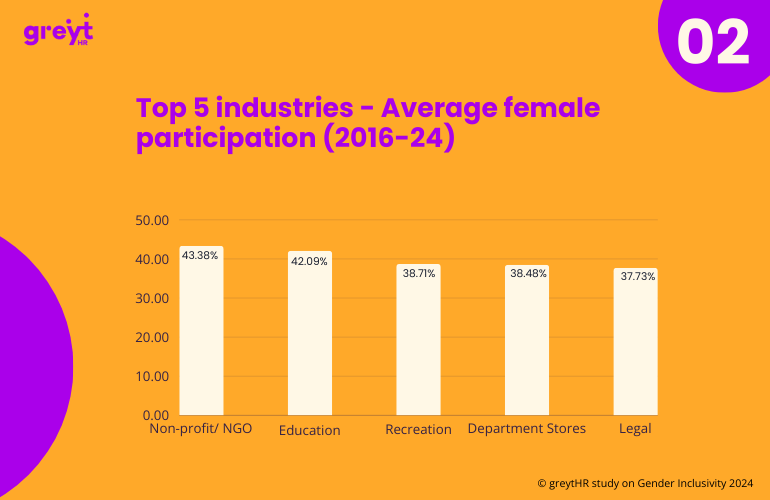
This chart showcases the industries with the highest average female participation rates, indicating sectors where women are more inclusively represented.
Non-profit/NGO, Education, and Recreation lead with the highest average female participation rates, reflecting sectors that have embraced gender diversity more effectively. Department Stores (Retail) and Legal sectors also show promising levels of female inclusion, indicating progress in traditionally male-dominated fields.
Industries Needing Attention

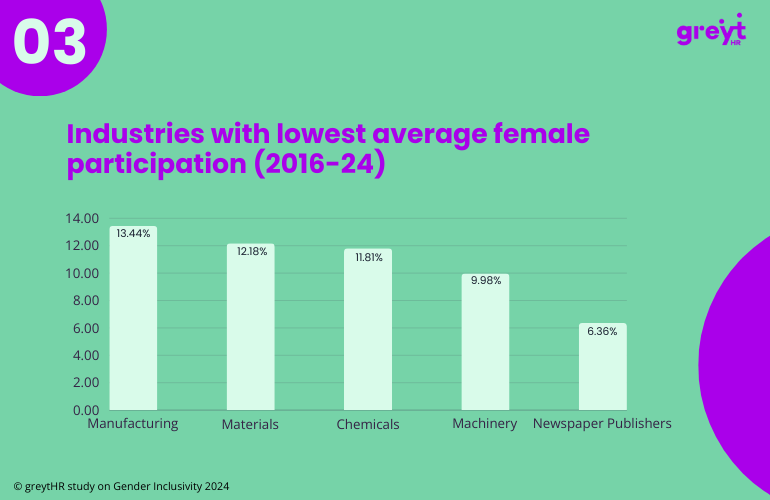
Conversely, this chart highlights industries with the lowest average female participation rates, pinpointing areas where efforts to enhance gender diversity are most needed.
Newspaper Publishers, Machinery, and Chemicals are among the industries with the lowest levels of female participation, highlighting significant gender disparities. Materials and Manufacturing sectors similarly show room for improvement, signaling the need for gender-focused initiatives.
Industries Leading the Diversity Movement

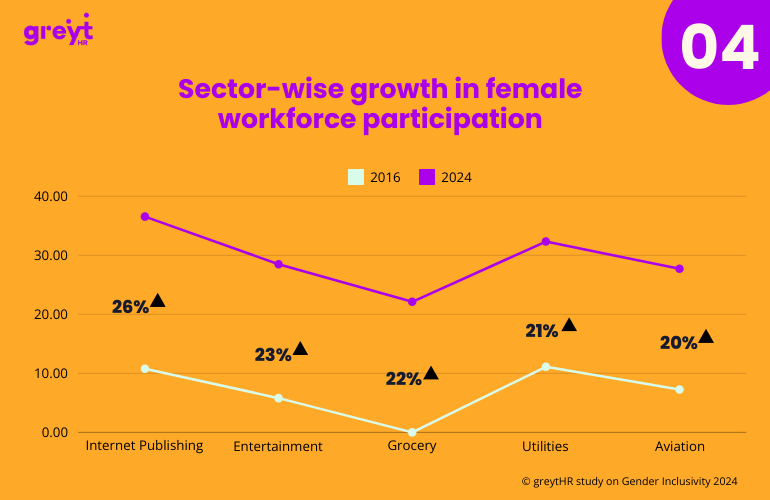
The chart above visualizes the increase in the percentage of the female workforce from 2016 to 2024 for the top 5 sectors
Over the last 8 years, traditionally male-dominated industries have shown increased focus towards creating gender diversity and inclusion. The jump in sectors like Internet Publishing and Entertainment could reflect changing dynamics in the job market and efforts to promote gender diversity. These insights could be indicative of broader societal shifts, including more inclusive hiring practices, changing perceptions of gender roles within these industries, and possibly the impact of digital transformation enabling more flexible work environments conducive to diverse workforces.
TL;DR | Key Insights
- The non-profit/NGO sector leads with the highest average female participation at 43.38%, showcasing its commitment to gender diversity.
- Education and recreation are also strong sectors for female employment, with more than 38% average participation, indicating a welcoming environment for women.
- Industries such as manufacturing report the lowest female participation, with just 13.44%, highlighting the need for more inclusive policies in traditionally male-dominated fields.
- The internet publishing sector shows the most significant growth in female workforce participation, with a 26% increase, reflecting a trend towards more flexible, digitally-enabled work opportunities.
- Overall, the industry-wide average female participation rate has risen steadily from 17.94% in 2016 to 25.58% in 2024, suggesting a gradual but positive change towards gender inclusivity in the workplace.
Charting the Path Forward: Recommendations for Bridging the Gap
The insights garnered from this analysis are not just reflective but also prescriptive, offering a roadmap to foster a more inclusive and equitable workforce.
- Industry-Specific Initiatives: Tailor interventions to the unique challenges of industries lagging in gender diversity, fostering environments that support female participation.
- Policy Reforms and Awareness: Advocate for policy reforms that address gender disparities and raise awareness about the benefits of gender diversity in all sectors.
- Supportive Infrastructure: Build supportive infrastructures, such as child care facilities and flexible work arrangements, to facilitate women's participation in the workforce.
- Skill Development and Education: Enhance access to education and skill development for women, aligning with the evolving demands of the labor market.
Conclusion
The state of gender diversity in the workplace is a reflection of broader societal dynamics, highlighting both achievements and areas needing attention. While certain industries demonstrate commendable progress towards gender diversity, others reveal significant room for improvement. As we honor Women's Day, let's recommit to advancing gender equality across all industries, recognizing the critical role of inclusive policies, cultural change, and supportive measures in achieving this goal. The journey toward gender parity in the workforce continues, with the collective effort of individuals, organizations, and policymakers being paramount in realizing this vision.
About greytHR
greytHR is a Full-Suite HRMS, with THE most advanced Payroll and Workforce Management in India and MEA.
greytHR simplifies, expedites, and even automates complex, recurring, and yet critical functions of HR and Payroll, in a compliant and secure way. greytHR offers productivity tools for better people management, simpler HR processes,and professional delivery of HR and Payroll services.
While it has a vast portfolio of HR products, greytHR’s deep product expertise is in Administrative HR, Payroll, Workforce Management and Employee Engagement. The platform also offers an app marketplace (to enable affinity use cases), mobile ESS, and lossless implementation. While other HR products barely scratch the surface, greytHR has productized deep and complex HR tasks.
greytHR software is currently used by 23,000+ organizations and 2.3 million users in India, and 25+ countries including UAE, Saudi Arabia, Qatar, Oman, Kuwait, and Bahrain.
Disclaimer
The data and analysis provided in this article are intended for informational purposes only. greytHR's metrics have been used to understand industry trends in female workforce participation from 2016 to 2024. While every effort has been made to ensure accuracy and reliability, the data is provided "as is," and the interpretations of the data are the author's own. Readers should consider the data in the context of broader economic and societal trends and are encouraged to seek additional sources of information before forming conclusions. The article also refers to findings from the Asian Development Bank Institute and Azim Premji University to provide additional context and does not claim to reflect the views or positions of these or any affiliated organizations.
References
Cledwyn Fernandez, Fellow, Indian Council for Research on International Economic Relations (ICRIER), India Havishaye Puri, Research Assistant, ICRIER, India, A Statistical Portrait of the Indian Female Labor Force, 2023
STATE OF WORKING INDIA 2021 One year of Covid-19 https://cse.azimpremjiuniversity.edu.in/state-of-working-india/swi-2021/
A Statistical Portrait of the Indian Female Labor Force https://www.adb.org/sites/default/files/publication/928471/adbi-statistical-portrait-indian-female-labor-force_0.pdf
Press Release by Ministry of Women and Child Development https://pib.gov.in/PressReleasePage.aspx?PRID=1967291
Countries ranked by the percentage of female workforce https://www.qualtrics.com/blog/countries-ranked-by-female-workforce/
